NBA 2025-26 Season — Data Visualization Lab
This page explores the top 25 points-per-game leaders through three charts. The central argument: raw scoring alone does not measure a player's true value.
Original Dataset — Top 25 PPG Leaders
Data through mid-February 2026. Source: NBA Official Statistics.
| # | Player | Team | GP | MIN | PTS | FG% | 3P% | FT% | REB | AST | STL | BLK | TOV | EFF |
|---|---|---|---|---|---|---|---|---|---|---|---|---|---|---|
| 1 | Luka Dončić | LAL | 40 | 36.2 | 33.6 | 47.6 | 34.8 | 78.0 | 8.0 | 8.8 | 1.5 | 0.5 | 4.2 | 34.0 |
| 2 | Shai Gilgeous-Alexander | OKC | 47 | 33.4 | 32.0 | 55.6 | 39.0 | 89.4 | 4.4 | 6.2 | 1.3 | 0.8 | 2.0 | 32.9 |
| 3 | Anthony Edwards | MIN | 40 | 35.3 | 29.4 | 49.5 | 40.9 | 79.9 | 5.2 | 3.7 | 1.3 | 0.8 | 2.7 | 25.9 |
| 4 | Jaylen Brown | BOS | 45 | 34.3 | 29.4 | 48.5 | 36.2 | 77.6 | 6.9 | 4.8 | 1.0 | 0.4 | 3.6 | 25.9 |
| 5 | Tyrese Maxey | PHI | 46 | 39.0 | 29.2 | 47.2 | 38.9 | 88.5 | 4.2 | 6.9 | 2.0 | 0.9 | 2.4 | 28.5 |
| 6 | LeBron James | LAL | 39 | 35.1 | 28.9 | 53.7 | 39.3 | 73.6 | 8.3 | 8.5 | 0.8 | 0.4 | 3.8 | 33.1 |
| 7 | Kevin Durant | PHX | 46 | 36.2 | 28.3 | 52.2 | 40.1 | 86.7 | 6.8 | 4.0 | 0.7 | 1.4 | 3.0 | 29.2 |
| 8 | Donovan Mitchell | CLE | 40 | 36.2 | 28.1 | 46.6 | 37.5 | 84.2 | 4.6 | 5.8 | 1.3 | 0.4 | 3.1 | 25.7 |
| 9 | Ja Morant | MEM | 33 | 32.9 | 27.8 | 47.6 | 31.7 | 77.3 | 6.8 | 9.7 | 1.0 | 0.5 | 3.6 | 28.8 |
| 10 | Devin Booker | PHX | 43 | 35.4 | 27.3 | 47.5 | 38.4 | 87.2 | 4.6 | 6.7 | 1.1 | 0.3 | 3.3 | 27.2 |
| 11 | Jayson Tatum | BOS | 43 | 36.5 | 27.1 | 47.0 | 36.4 | 83.3 | 8.9 | 4.7 | 0.8 | 0.5 | 2.7 | 28.2 |
| 12 | Karl-Anthony Towns | NYK | 44 | 32.1 | 26.5 | 50.0 | 39.9 | 84.6 | 13.6 | 3.5 | 0.8 | 1.2 | 2.6 | 31.5 |
| 13 | Scottie Barnes | TOR | 46 | 35.7 | 26.2 | 46.8 | 36.1 | 77.1 | 9.3 | 6.3 | 1.4 | 1.0 | 3.2 | 29.5 |
| 14 | Cade Cunningham | DET | 48 | 35.5 | 25.7 | 46.7 | 36.9 | 83.3 | 5.9 | 9.8 | 1.2 | 0.3 | 4.0 | 28.9 |
| 15 | Paolo Banchero | ORL | 41 | 34.6 | 25.5 | 47.9 | 34.5 | 79.6 | 6.9 | 5.8 | 1.0 | 0.7 | 3.0 | 25.1 |
| 16 | Trae Young | ATL | 46 | 34.0 | 25.4 | 44.6 | 37.5 | 88.7 | 3.2 | 11.3 | 0.9 | 0.2 | 4.4 | 24.4 |
| 17 | Nikola Jokić | DEN | 47 | 33.7 | 25.2 | 55.5 | 36.5 | 82.8 | 12.1 | 9.4 | 1.5 | 0.8 | 3.1 | 38.1 |
| 18 | De'Aaron Fox | SAS | 47 | 34.4 | 24.2 | 45.9 | 37.7 | 89.3 | 4.0 | 6.6 | 1.1 | 0.3 | 3.3 | 23.1 |
| 19 | Victor Wembanyama | SAS | 34 | 28.9 | 24.1 | 50.4 | 36.4 | 83.3 | 11.1 | 2.7 | 0.9 | 2.6 | 2.7 | 29.4 |
| 20 | Pascal Siakam | IND | 47 | 34.0 | 23.8 | 48.3 | 37.7 | 68.9 | 6.9 | 4.0 | 1.1 | 0.5 | 2.2 | 22.6 |
| 21 | Jalen Johnson | ATL | 46 | 35.6 | 23.1 | 49.9 | 36.0 | 78.0 | 10.5 | 8.0 | 1.3 | 0.5 | 3.5 | 30.0 |
| 22 | Norman Powell | MIA | 43 | 30.7 | 23.0 | 47.2 | 39.2 | 84.4 | 3.7 | 2.6 | 1.2 | 0.2 | 2.0 | 19.2 |
| 23 | Julius Randle | MIN | 50 | 33.3 | 22.3 | 49.3 | 33.5 | 81.9 | 6.9 | 5.4 | 1.2 | 0.2 | 2.6 | 24.2 |
| 24 | Brandon Ingram | TOR | 49 | 34.1 | 21.9 | 47.0 | 35.8 | 83.6 | 5.9 | 3.7 | 0.8 | 0.8 | 2.6 | 20.6 |
| 25 | Shaedon Sharpe | POR | 45 | 30.3 | 21.9 | 45.8 | 34.6 | 77.8 | 4.6 | 2.7 | 1.5 | 0.1 | 3.1 | 17.0 |
Chart 1 — PPG vs. Efficiency Rating
Analysis
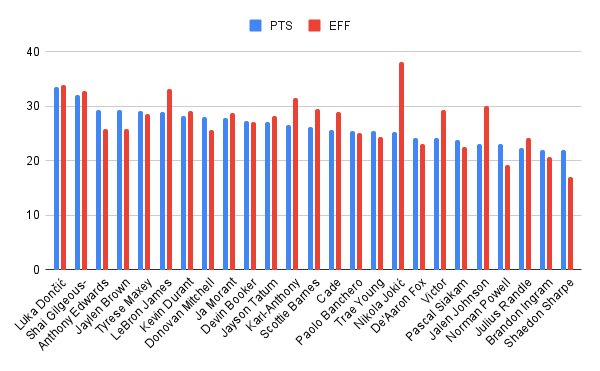
This grouped bar chart compares raw points per game (PPG, blue) against each player's Efficiency Rating (EFF, red). EFF is a composite stat that adds rebounds, assists, steals, and blocks while subtracting missed shots and turnovers.
The most striking gap belongs to Nikola Jokić, who ranks #17 in PPG (25.2) but leads the entire dataset in EFF at 38.1 — a 13-point surplus. On the opposite end, Shaedon Sharpe scores 21.9 PPG but holds an EFF of only 17.0. Conclusion: raw scoring flatters volume shooters. EFF reveals who is actually helping their team win.
Chart 2 — Field Goal % vs. Points Per Game
Analysis
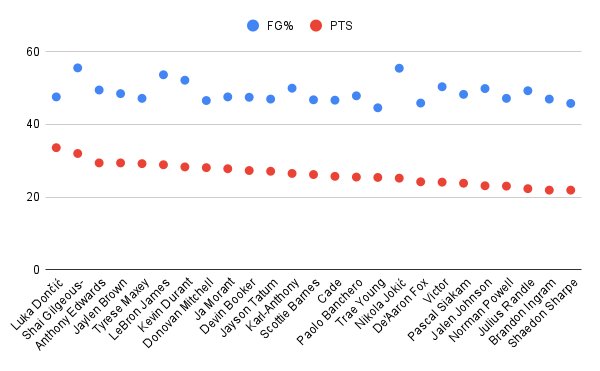
This scatter chart plots shooting efficiency (FG%, blue) and scoring output (PPG, red) across all 25 players. The two data series float on separate horizontal bands, making it easy to spot players whose shooting efficiency is unusually high or low relative to their scoring rank.
Conventional wisdom assumes high-volume scorers sacrifice efficiency. The data says otherwise. SGA (55.6% FG / 32.0 PPG), LeBron (53.7% / 28.9), KD (52.2% / 28.3), and Jokić (55.5% / 25.2) sit at the top of both bands simultaneously. Conclusion: shooting efficiency and high scoring volume are not at odds — the best players do both.
Chart 3 — Assists vs. Rebounds Per Game
Analysis
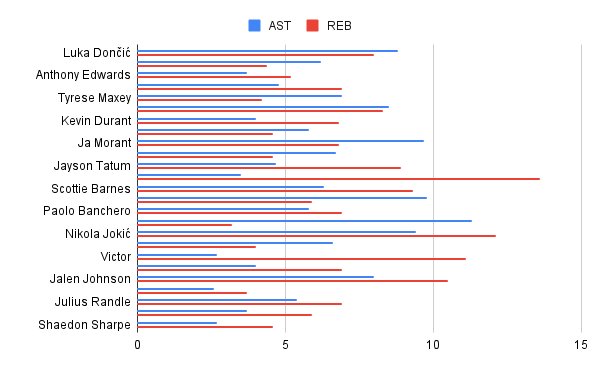
This horizontal bar chart ranks a subset of the top scorers by assists (blue) and rebounds (red) per game side by side. Players are sorted so that the most versatile appear at the top.
Traditionally, big men grabbed boards and guards dished assists. This chart shows those lines have blurred. Jokić (12.1 REB / 9.4 AST), Luka (8.0 / 8.8), and Jalen Johnson (10.5 / 8.0) dominate both bars. Compare that to Shaedon Sharpe (4.6 / 2.7) — a pure scorer with little else on the stat sheet. Conclusion: the NBA's elite scorers are full-floor players. Two-dimensional scorers are vanishing from the top of the leaderboard.